Archive for the ‘buses’ Category

The High Cost of Free Incentive Parking

Wednesday, July 13th, 2016

I have a confession to make: I think park’n’rides, or incentive parking as we call them in Montreal, are a bad idea.

Everybody seems to be asking for more and more incentive parking these days, and anyone questioning the driving component of our transit cocktail model may incur the anger of drivers and get painted as some sort of tofu-loving anti-car zealot. Well, I don’t like tofu, but I don’t like free park’n’rides either. Besides being bad for the city, they just don’t make economic sense.

Most people assume providing parking basically costs nothing for a transit agency. Plop a parking lot next to a train station, and you never have to think about it again. Just drive to the station and take the train.

Except, it turns out that parking is surprisingly expensive.

First, there is the one-time expense to buy the land and then to build the parking lot. Then, the parking lot requires a variety of operating expenses for things like maintenance (snow clearing, salting, cleaning, raod work…), security (lighting, cameras), and taxes, to name a few.

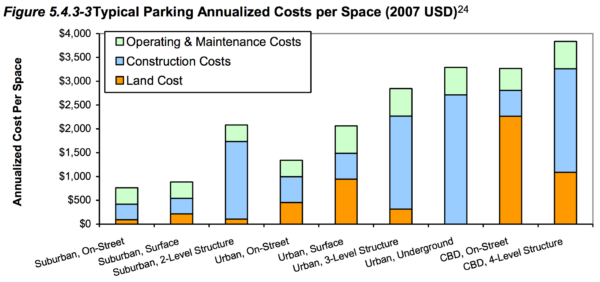
It’s not so easy to figure out what the exact cost is to provide free parking, broken down per user and per day. One good source is this 2016 study analyzing the total cost of providing parking, that is, land, construction and maintenance costs, in the US. The following graph shows the annualized costs for different types of parking spaces (note: land and construction costs are amortized over 20 years):

parking-chart

According to the study, surface parking lots typically costs around $1000 in the suburbs and $2000 in the city per year to provide. Those numbers were for 2007 and in US Dollars, so after adjusting for inflation (9 years, 15% total) and converting to CAD, that’s about 1500$-3000$ per year. Every year. For one single parking spot.

Another source, Calgary Transit estimated its 2011 parking costs to ~700$-1642$ per year (assuming 20 year amortization for a lot, and 40 year amortization for a parking structure).

Another survey of parking of American Transit agencies found the average operating cost for a total of 288,000 parking spots to be 1,100 USD per year, or about 1,425 CAD (see this spreadsheet). What’s interesting is that even though the transit agencies charge around 4.50$ per day on average for parking, on average they only recover 34% of the parking costs.

Now, consider that every commuter parking spot can pretty much be used by only one car every day. One person, who drives to the train in the morning and picks up the car after work in the evening. If we’re lucky, we may get up to 1.3 people per vehicle, which is the average occupancy rate of a car.

Moreover, in Montreal, the commuter rail parking lots of the AMT have an occupancy rate of 80%, but the unused 20% still has to be paid for.

Overall, your typical free parking costs around $7.20 to $14.40 per weekday to provide, subsidized by the transit agency or the city.

$ 1500 / 260 work days = $5.77 per day
 $ 5.77 / 0.80 occupancy = $7.21 per day
$ 3000 / 260 work days = $11.54
 $ 11.54 / 0.80 occupancy = $14.42

In terms of economic efficiency, this is quite a waste of money. Instead of having drivers go downtown and have them pay for their own parking, everybody has to pay for the drivers who park near a transit station, on top of having to subsidize the transit itself as well. If this is an ‘incentive’ that society provides to encourage transit use, we’re getting a pretty bad return on investment. Because the advantage of a few drivers being able to park near transit does not outweigh the money that we collectively spend to provide that parking.

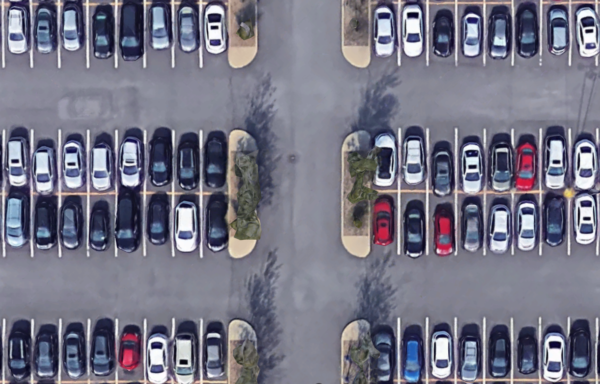
If we look at cost per user, it is much more efficient to provide bicycle-parking in those same lots. It is possible to fit 15-20 bicycles in the space required for one parking spot in a parking lot. That’s because the lot is actually twice as big as the actual space required by a car: you need one car-area to put the car, and the equivalent of another car-area for the car to drive to the parking spot.

Park’n’Ride at Terminus Chevrier, only about half the space is used by the parking spots

Park’n’Ride at Terminus Chevrier, only about half the space is used by the parking spots

And walking to the station is even more economically efficient – it’s free.

Comparing with Feeder Buses

Of course it’s not realistic for everybody to just cycle to transit stations, and many don’t live within walking distance. So how else can we bring people to the trains?

The most popular alternative is to provide feeder buses, which collect passengers and bring them to the bus station. And despite requiring drivers and equipment, a feeder bus may actually be cheaper than parking!

Unfortunately, transit agencies don’t generally provide enough information that allows estimating how much it costs to provider feeder buses per person, so we can only infer from available numbers.

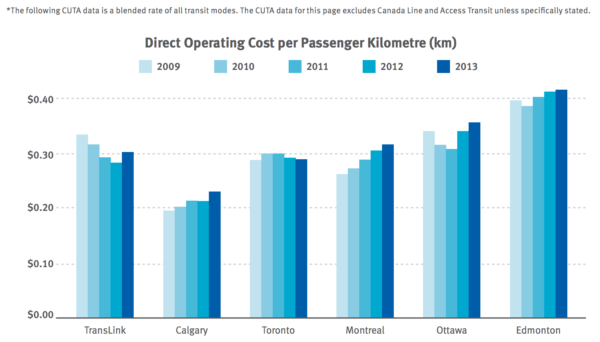
In 2014, Translink, Vancouver’s Transit Agency, published a report which contains a table of costs for operating transit per passenger-kilometer.

cost-comparison

The chart shows blended operating costs, which is the overall operating cost for bus, metro, and rail combined, for several Canadian cities. We see from the graph that operating cost is lower in Calgary and higher in Ottawa and Edmonton. The difference is consistent with the transit model in every city: Calgary has an efficient light rail system, which is cheaper to operate than buses, because the vehicles are much larger, and most of their buses feed into the light rail. On the other hand, Edmonton and Ottawa have much smaller rail systems, and have to rely on the more expensive-to-operate buses.

According to this chart, Montreal’s transit operating cost was a little over $0.30 per passenger kilometre in 2013. Since this number does not take into account capital costs, we can adjust it up by about 20% (capital costs for buses is about 20% of operating costs) and round it up to $0.40 to account for the blending of different modes.

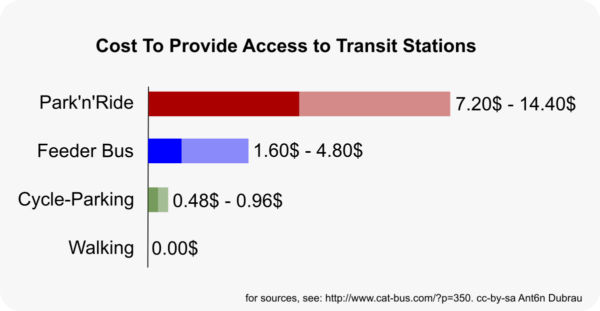
This means that bringing a person to a train station 2km away by bus costs about $1.60 per day (2 trips). Even if the person lives 6km away, this would only cost $4.80, which is still much less than providing parking, which costs $7 or more!

Note on distance: on the island of Montreal, only few people are farther than 6km away from a rail station, Commuter rail included (which is where most of the parking is). Even in the South Shore (Brossard and Longueuil), most are within 4km of the major transit terminals (Terminus Longueuil, Terminus Panama, Terminus Chevrier) and the commuter rail stations.

Overall we get the following cost estimates:

transit-access-chart

Alternative Use of the Space used for Parking

If you get more people to take buses from their homes, walk, or maybe even take a bicycle, you free up the land right next to the station. So instead of wasting valuable transit-adjacent land on parking the land can now be developed, to build apartment, commercial or office buildings and generate property taxes for the city, which in turn can be used to improve feeder buses. (The cities already pay most of the subsidies to operate transit).

People will want to live there, because they can quickly get downtown and businesses would want to locate there, because many people pass through the area. Transit stations would become the centers of little transit towns.

But also, you suddenly have people who don’t need to rely on either parking or feeder buses to get to the transit station – because they’re already right next to the station. Anybody who doesn’t need a bus or a parking spot to get to transit will be less expensive for the transit system as a whole.

Transit systems are based on cross-subsidies: some people pay more, so that others pay less. Short trip commuters subsidize those who go from one end of the line to the other. Metro users subsidize bus-&-metro users. The person who takes one ride pays the same as the person who uses a transfer.

And free incentive parking users should realize that they are benefitting from a premium service provided below cost – and provided to those who are more likely to be better off. In effect, those walking, cycling and even those taking buses are subsidizing the car owners who receive free parking.

When people complain about the lack incentive parking, remember that free parking is uneconomical. Money was invested in parking, when it could have been invested in service.

Space was allocated to parking, when it could have been developed to bring in tax revenue.

And maybe we should realize that parking at rail stations should not be free.


Appendix: What does a Developed Train Station look like?

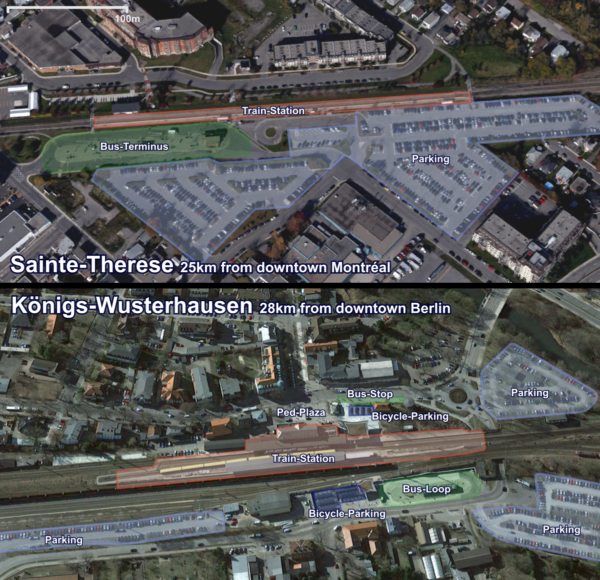
The following shows the comparison of two suburban transit stations, inside suburban towns of similar sizes that are in turn in metropolitan areas of similar size. One stop is immediately surrounded by parking, the other by a walkable town.

Above: Sainte-Therese (population 26K), 25km from downtown Montreal (pop 3.9M). 
Below: Königs-Wusterhausen (pop 34K), 28km from downtown Berlin (pop 4.3M).

st-therese-vs-konigs-wusterhausen-labels

In Sainte-Therese, the rail station is close to the middle of town. But the parking is plenty and right next to the station, displacing the chance for a town centre. There are some condo-buildings around, but most of the area surrounding the station consists of low-density commercial buildings, most with more parking. There’s also a large bus terminus with 11 bays using up a lot of space as well. The terminus services thirteen lines.

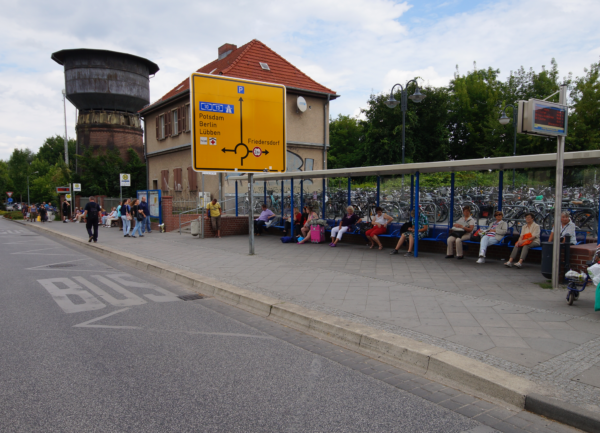
By comparison, the Train Station in Königs-Wusterhausen is the center of a small town, with a pedestrian plaza, a mixed-use town-centre, plenty of bicycle parking, and bus stops served by a total of fifteen bus lines. Parking is still provided, because of increasing motorization levels, sprawl, and the resulting pressure to provide parking, but it’s pushed further away from the station, mostly to the far right.
konigs-wusterhausen-bus-station
The primary bus stop in Königs-Wusterhausen is small in area, because its primary purpose is to pick up and drop off passengers, not to store buses in the middle of a town. Image source.
Montreal Tram Study – Going About it the Wrong Way?

Thursday, May 9th, 2013

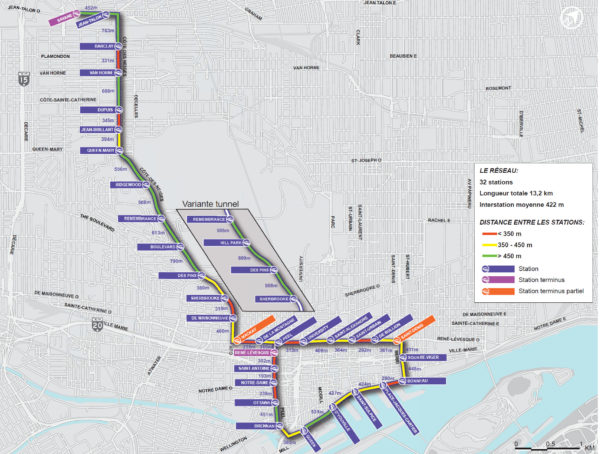
A Montreal tram report studies the viability of a starter line. However, the proposed line includes a downtown loop, a section with questionable utility. Also, the proposed construction costs are too high. If we want a sensible network of trams that improves rides for as many people as possible, we need to focus on utility, and we need to aggressively contain costs.

tram route

Last week the city of Montreal finally released their tram study, which the city received 18 months ago. The 1095-page study details the feasibility of a starter line. Here are the highlights:

  • line length: 13.2km
  • number of stations: 32
  • average distance between stations: 425m
  • average speed 18.1km/h
  • projected ridership: 26.6 M/year (70K a day)
  • trams: 26 trains, 30-35m length, 2.65m width
  • cost: 850million, without tax and contingencies (about a billion with)

As you can see from the above map, the line consists of a corridor along Côte-des-Neiges and a loop around the Old Port. The line is on separated lanes on its entire length. The base service frequency is intended to be around 8 minutes. During rush hour, the Côte-des-Neiges corridor would see the frequency double to every 4 minutes. During the “peak downtown period”, the pattern would reverse, with the downtown loop now having its frequency doubled to every 4 minutes.

It is great that this study was finally released. It would be nice if the AMT did this too. Its also good news that the basic viability of trams in Montreal is shown. But looking over the documents, there are some issues that I would like to raise.

The Downtown Loop

The first thing to notice is the loop around Old Montreal, a section that seems to be a rather bad piece of planning. Actually it’s not a complete loop with trains travelling in a complete circle, because it’s disconnected at the north-west corner, where trams terminate and turn around. The construction of this loop seems to be mostly driven by political interest, and from developers. In general, downtown circulators are a bad idea, they underperform. They are not useful for enough people. They don’t let you travel the shortest distance to where you need to go. Many travels along small loops are faster by walking directly, rather than waiting for a train and taking an indirect route to a nearby location.

In 2008, The STM established the 515 bus (now 715) as a precursor for the planned tram (except that it actually runs in a complete circle). Already by Decemeber the failure of that line was obvious, with only 1200 daily boardings rather than the projected 6000. According to ridership data from 2011 that I extracted from Opus card data, there were less than 800 daily boardings on that bus. That is not nearly enough for a tram. and given that there are many bus corridors with fifty times the daily boardings like Pie-IX, Sauvé, Saint-Michel or Henri-Bourassa, focusing on this section is misguided at best.

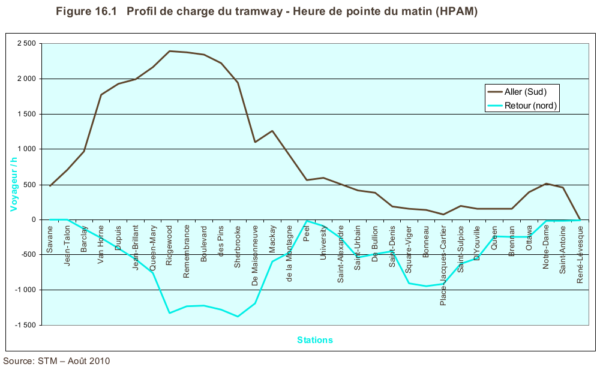
Naturally, a tram may attract more potential riders, and more development, which should bring more riders. The study considers this induced demand, and gives us this graph of what the STM projected hourly ridership during the peak period would be like:

profileChargeDuTramway

We see that according to the projections the Côte-des-Neiges section shows much more potential than the downtown loop, which simply cannot attract riders. And those numbers may be optimistic, just like the projections for the 515 bus. Many riders may also only be seasonal, and that’s not just tourists. And the Côte-des-Neiges and downtown loop section appear to have non-connected ridership. Trams are nearly empty somewhere along the middle of the line. There are few potential trips that cross those points.

Overall, the downtown loop is simply a waste of money considering the transportation needs of the greater Montreal region. The only section along the the loop that has some potential is the Peel corridor along the West of the loop. That portion overlaps with the another transit plan along the Champlain bridge light rail. This is a transit project to connect the Shore suburb of Brossard to downtown, via the replacement Champlain through Nun’s island and Griffintown. That project is very worthwhile and would make the less than 2km track along Peel redundant.

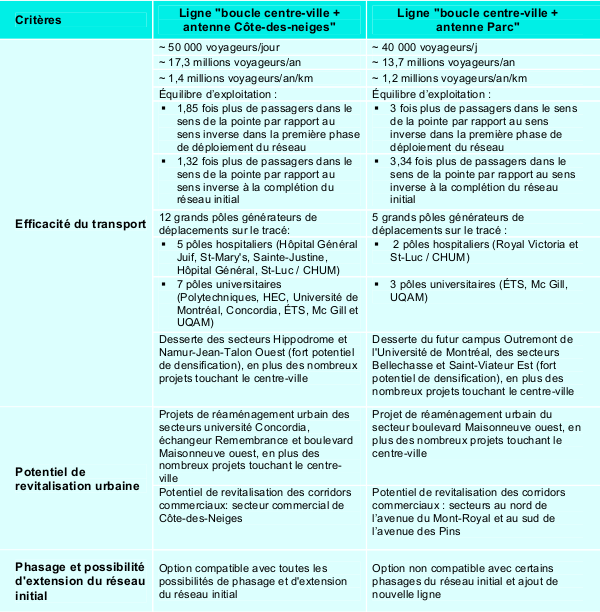
The study also compares two possible corridors for the non-downtown-loop portion, Côte-des-Neiges and Ave due Parc:

Côte-des-Neiges vs Parc Ave

The above table shows that the the Côte-des-Neiges corridor is a better than the one along Parc, which appears reasonable. But why were the two corridors compared for their potential, but the downtown loop was included in both cases seemingly without question?

The two compared corridors have similar ridership, so it appears natural to just connect them into one line which will have fairly balanced ridership. This would almost exactly follow the successful rush-hour-only 435 bus. It would be possible to “unroll” the downtown loop, and instead build it along the Parc corridor. The length of that line would be about the same as the one proposed by the study, ~13km. This line would replace the 80, 165 and 435 buses, which together have about 60K daily boardings (in 2011) – when one considers the possibility of induced demand, it should be obvious that this is a much more worthwhile starting segment than including the proposed loop with only one of the useful corridors.

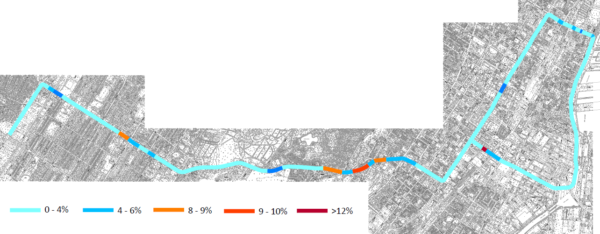
Another, if smaller, issue is that the downtown loop includes the steepest grade along the whole line – the ruling gradient:

grades

Because of only the small section of 12%, all the trains have to be able to climb that grade. If excluded, the ruling grade is 10%, which is generally considered the maximum for trams. This may result in less technical complexity, more bidders on the rolling stock, and less cost for vehicle acquisition.

Cost

The cost is currently budgeted at 850$ million for 13.2km, without taxes and contingencies, a billion with those included. That means about 65$ million/km without taxes and contingencies, and 75$ million/km with. This appears pretty high. For example, the French city of Besancon is building its initial 14.5km line for 22 million$/km. This is of course only one data point. the Montreal tram study compares to five different French data points to show that the cost are not too high.

To get a more thorough comparison, I compiled a list of about a hundred French tram construction projects. It covers projects from the beginning of the tram renaissance at the end of the eighties, to projects being planned now. The numbers are all without taxes, adjusted for inflation relative to 2010 (to compare to the Montreal study) and converted to dollars using the average rate of that year (1.37$/€). According to these numbers, the construction costs in France for a kilometer of tram are about 35$ million/km on average. In comparison, the Montreal costs are estimated 85% higher than that. (I will publish the data and more details in another blog post soon).

French tram projects aren’t actually considered cheap. They tend to include a lot of urban improvement and renovation of the streetscape, and are built to a high visual standard. They are used as drivers for development not just via transportation, but also urban beautification. The tram systems tend to be a little over-designed. Some of the systems include short tunneling sections. The French also like to avoid overhead wiring in their historic city centers, using a system called l’alimentation par le sol (APS), a ground level power supply, which adds to the cost.

Compare to Germany, where trams are used as a form of transit to bridge the gap between buses and subway, rather than a chance to beautify the city. There, tram construction costs are generally considered to be at around 10 million €/km (14 million$/km) and 15million € when built in downtown (21 million $/km). A more utilitarian approach is also what allowed Besancon to keep its tram construction low.

There are some budget items in the Montreal project that are inherently more expensive than elsewhere, for example the maintenance center and garage. It has to be completely indoors, due the climate. But overall, the construciton costs should be lower, because the project is comparably simple. The tram can be completely contained inside the existing streetscape. There are no heavy works required like rebuilding bridges. It shouldn’t need any of the features that drive up cost, for example tunnels or ground level power supply. And while nice, it doesn’t need urban beautification along its entire length.

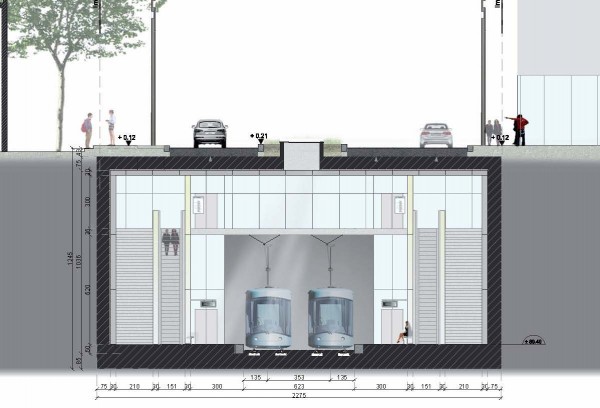
Pine Tunnel option.

The study includes a 100$M option for a 500m tunnel under Pine, providing better access to the Montreal General Hospital via an underground station. This is probably not a worthwhile investment. But note how over-designed this tunnel station is: wider than some metro stations, three elevators, 12m deep, and a tunnel height of 6.2m. It could be designed with a 6~8m island platform, directly under the street, with a single elevator and stairs, no mezzanine, and tunnels that are barely higher than the trains themselves.

What is the Role of a Tram?

All trams are not created equal. There are different paradigms of how trams are built and what exact purpose they have in terms of transportation and urban development.

In France, the tram systems built over the last twenty years have been urban development and renewal projects as much as they are transportation projects. There has been great care to integrate those trams into historic centers with its pedestrian areas, and a lot of money spent on beautification and new technology that avoids overhead wires in certain sections. At the same time, they are the major mode of transport in some medium size cities (i.e. around and less than a million). Some of those metropolitan areas are pretty compact, so these systems have high ridership.

In the US, the development potential of trams has been recognized. Now there are a few new projects underway to build streetcars. Many of these projects have little transportation value, using single, short lines, sharing space with cars. Some are only single track for portions and have very low frequency. These projects appear to be built solely for their development potential.

In Germany, trams tend have more utilitarian transport character. They are built generally as pure transportation projects, in corridors where ridership is expected to be between about 4K and 30K~40k per day, above which rapid transit is favored. Towards the high end, they tend to build subway-tram hybrid systems (Stadtbahn), which attempt to combine advantages of subway (high capacity/speed downtown) with trams (cheaper construction or possibility of re-using existing systems to get good coverage).

So what Role Should Trams Have in Montreal?

The released study appears to orient itself very closely to the French model of tram building. That’s evident not just in the use of pictures and comparisons for cost and rolling stock, but also how the development of the line is envisioned, the complete re-configuring of streets. The loop around the old port may also be an attempt to replicate the image of the French tram through a historic city center.

Given the high cost of the project relative to its transportation value, especially in comparison to other tram systems, I’m concerned that we may end up with a project that is largely a development stimulus one. The chosen paradigm may not lead to transportation improvements throughout the city, simply because building a large network at this cost is not economically viable. This is problematic for our transportation starved city.

Montreal is currently a major bus city, with many people spending large amounts of time in crowded buses feeding into metros. Some of our bus corridors have more ridership than the 40K/day that Germans consider good enough for rapid transit, many more have lower ridership which can still be more economical to operate as trams. For many of these riders that live further away form the metro, trams could improve the quality of their commute, and thus the quality of life. A large network could spread the development and gentrification pressure, and allow less affluent people better access to jobs, again rising quality of live for everybody.

Trams in Montreal should primarily be used to improve existing bus commutes. Tram projects should be about transportation, not helping development interests downtown.

Costs Need to be Contained

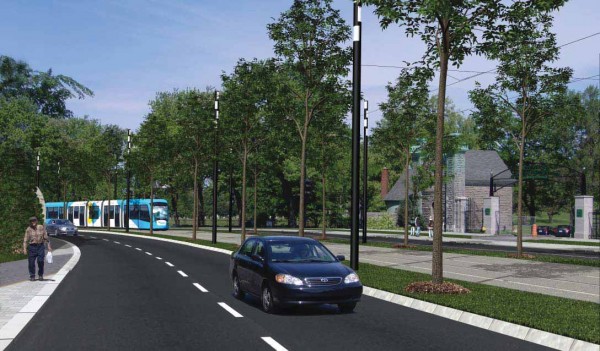
If we want to build as many tram lines as possible, we have to focus more on keeping the costs down. Construction should be simplified. For example, we don’t need to reconfigure entire streets. For the tram line in the study, we could do that just for the René-Lévesque Levesque corridor, and only few parts of Côte-des-Neiges.

Beautifully rebuilt portion of Côte-des-Neiges where nobody lives and development potential is low.

Beautifully rebuilt portion of Côte-des-Neiges where nobody lives and development potential is low.

The downtown loop, with its relatively small transportation value, should be scrapped. Instead, the Parc Ave corridor should be preferred. If we aim for good cost/benefit in terms of ridership and improved commutes, one could also pick a completely different initial segment. why not start the tram outside of downtown, for example along the Pie-IX or Gouin/Henri-Bourassa corridors?

Pie-ix currently has a expensive BRT project, at 20$M/km. It suffers high cost (for a BRT project) due to a similar issue as the proposed tram: rebuilding the street. The project includes widening its right of way from 30.5 to 33.5m. With a tram, the transit right of way could be narrowed from the planned 8.40m (for two bus lanes) to as little as 6.35m (using 2.4m wide trams). Steal some more space from wide car lanes, and it will be unnecessary to buy land and cut down trees, and the higher cost of the track could be partly offset by reducing the street-widening costs. The maintenance center and garage may be cheaper further away from downtown. And the potential to improve people’s commutes is greater along that corridor, that sees long, crowded bus commutes.

Other ways to keep construction costs down for any tram project may be to partner up with other Quebec cities that envision building trams, like Quebec City, (or the AMT for the Champlain bridge corridor), or cities that think about building trolleybuses, like Laval. The rolling stock and related expertise could be pooled and large orders be made, which result in lower per-unit prices. The development expertise and management may be shared and done in-house, potentially reducing costs (right now budgeted at 100$M before tax, nearly as much as the rolling stock).

I really want trams to come to Montreal. But if we cannot keep the costs down, and the city has to plunk down a cool billion for 13 km, and the possibilities of building an actual network are slim, then this will just become another project in the region that envisions one short line and yet another technology. In that case, maybe it makes more sense to invest in much cheaper improvements to our bus corridors.

Thanks to Kamal Marhubi and Julia Evans for reading drafts.

Montreal Frequent Service Map – Update

Thursday, February 14th, 2013

MontrealFrequentService150

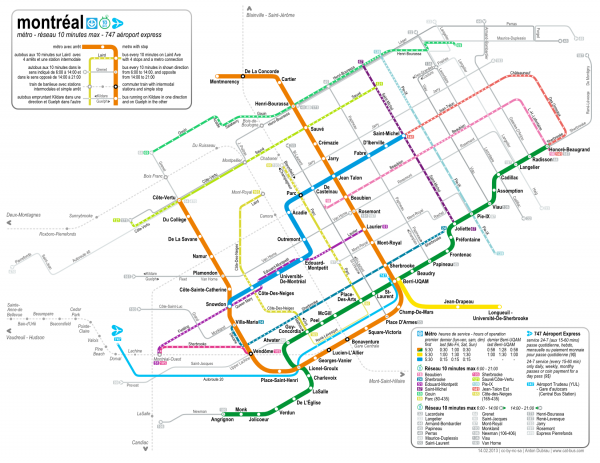
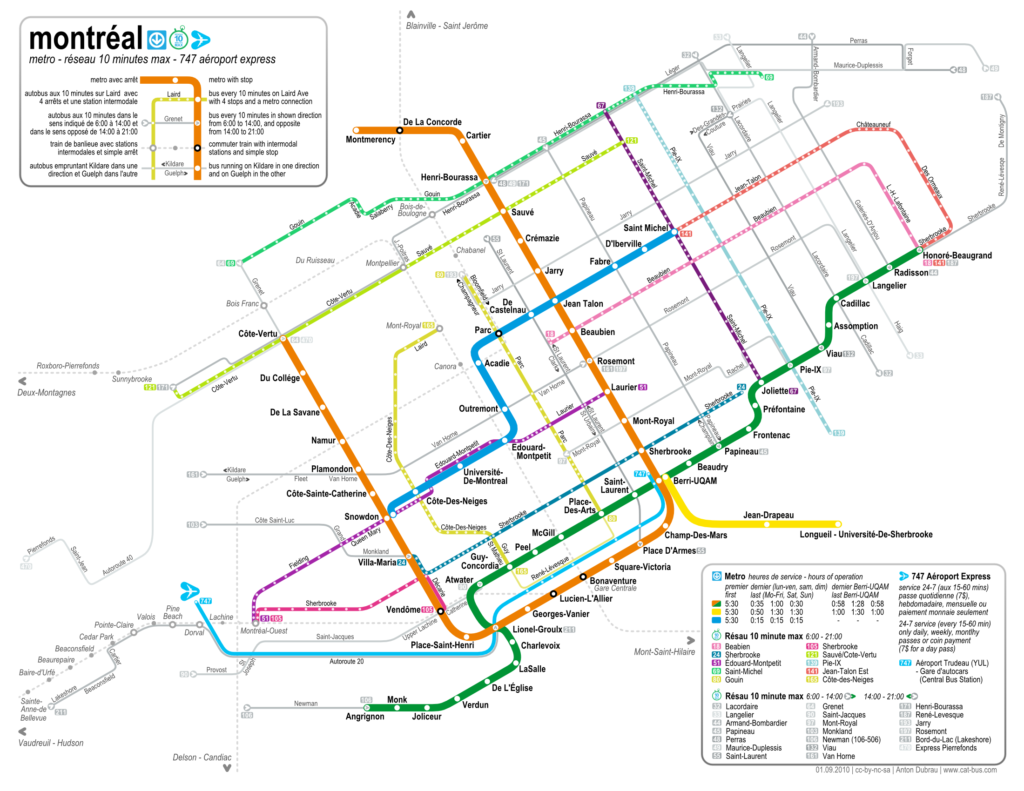
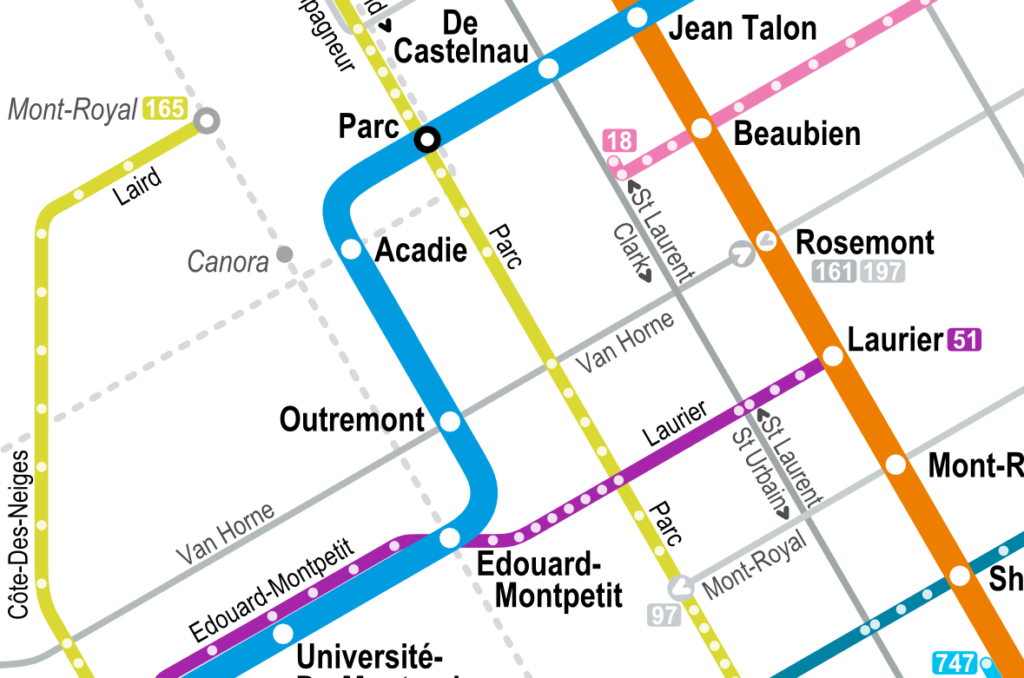
This has been a long time coming, I’ve finally gotten around to update my Montreal Frequent Service Map. This is a map of the Montreal Metro and the whole 10-Minute Max Network. There haven’t been many changes:

  • The 211 Lakeshore is not a 10 minute bus any more. The STM chose instead to create a network of West Island express buses. Some of these follow approximately the route of the 211, so many of the stops along that route may actually see frequent service to Metro Lionel-Groulx every 10 minutes. But the routes are not exactly the same, and the mess of that all is against the spirit of a frequent service map.
  • The 132 Viau is now the 136 Viau.
  • The daily pass needed to use the 747 airport express now costs 9$.

I also took the opportunity to enlarge the West Island, and improve the proportions west of the Orange line, and added the missing LaSalle commuter rail station. I again made a 600 dpi version, which can be found here, and a pdf.

A Map for Montréal’s frequent service

Thursday, September 2nd, 2010

As mentioned in a previous post, I’ve been working on a frequent service map of Montreal’s new réseau 10 minute max (10 minute network). Just a couple of days after the new schedule went on effect on August 30th, I am now publishing this map (under cc-by-sa-nc).

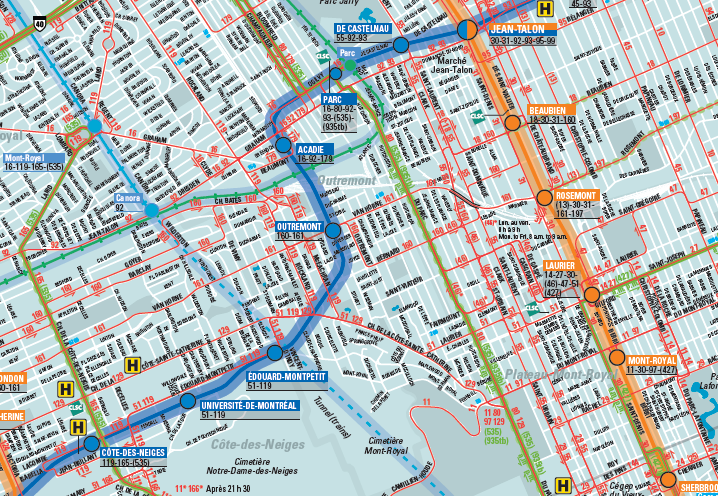
The stm also published a map. But theirs is basically just the full system map with the whole system (except the metro) removed and the frequent lines added in thick lines — it’s still a huge map (because it is geographically accurate), for a relatively simple system. Also, the lines often sit on top of the metro lines, so it’s hard to read.

I wanted to make a map that is similarly abstract as the old metro map, to show the similarity between the frequent service network and the metro system itself. Both should be accessible without needing any schedules, or knowing the area well where one is travelling. I wanted to combine the simplicity of the traditional tube map with the look and feel of the Montreal metro map (and the new stm designs) while adding in the frequent bus lines – and all that in a letter format.

The result is indeed letter sized (with 5mm margins), and designed to fold twice (along the legend boxes), albeit with some pretty small fonts. Nevertheless, it should be possible to carry this map along all journeys much more easily than the whole system map — this independence is sort of the intent of the original London tube map, and also of the new frequent service network.

I added the commuter train stations on the island of Montreal, something that the metro map doesn’t show. Although they don’t run frequently, the connections are good to know and an imprtant aspect of the public transportation network — so they are shown in greyed out, dotted lines. I also added the airport express bus, even though it runs at a lower frequency than 10 minutes, because of it’s success and general importance. The legend shows that it runs less often.

The stm chose a system of 11 lines with 10-minute frequent service running form 6am to 9pm, and a set of 19 lines that run frequent in the downtown direction from 6am to 2pm, and in the opposite between 2pm and 9pm. These lines don’t qualify as all-day frequent service, so they are also shown greyed out, with arrows indicating the morning/downtown direction. I assigned colors to the all-day frequent lines as if they were metro lines, based on the sort of pastell color theme of the stm.

A feature that is not even in the full system map is the indication of all stops along the bus lines. While I didn’t actually name any, it still provides useful information – it gives an indication of how long it takes to traverse a certain route (the more stops the longer it takes), and it gives an idea of how many stops it takes to go from one intersection to another. The one should help people to be more independent of schedules by being able go estimate how long a trip will take, and the other helps people to navigate the city riding the bus without knowing a certain area. Both are intended to lower the barrier of entry for new users (or users new to an area, or tourists) to be able to use the bus system. A focus on usability in public transport systems (especially buses) is sometimes lacking, but attempting to create user experience similar to a metro system should help attracting riders.

A 600 dpi version can be found here. And a pdf. Or the svg. (update: I correct errors only on these files.)

This project was partly inspired by Jarret Walkers treatment of frequent service ideas over at human transit. Most of the above links direct to his discussions of the topic. I have also taken a closer look at the bus network.

Check out the most recent update.