Archive for the ‘map’ Category

Walksheds Visualized:
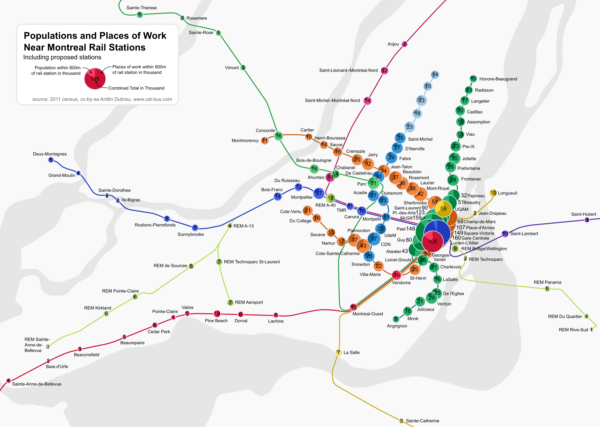
Showing Population and Places of Work
within Walking distance of Montreal Rail Stations

Friday, July 22nd, 2016

walksheds

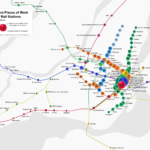
A while back I published a map of Montreal showing the populations living within walking distance of rail stations in the region. At the time, many asked me to add places of work as well, and proposed new stations. Today I’m publishing a map that includes these, and I’ve made it look prettier as well.

The area that is reachable within walking distance of a station is called its walk-shed. The actual walking distance depends on the geometry of the street, and also on the person. Some are more willing to walk a longer distance than others. I picked the commonly used 800m or half a mile distance (as the bird flies) as a reasonable approximation.

The population data comes from the same census as the previous map (which is the most recent one we have), the work places are extracted from a census map as described here.

Note that in places where the stations are closer together, the walk-sheds will overlap. This is intentional, as I want to show the density just as much as an absolute number.

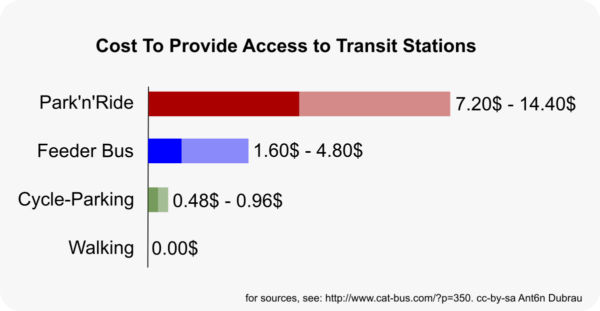
Every residence and every work place within walking distance of a train station is the potential beginning or end of a transit trip that does not require parking or a feeder bus. Both can be very expensive, and also make using transit less desirable. The system is most effective and most financially sustainable when as many people as possible live within walking distance of stations.

I tried to estimate the cost to provide feeder buses and parking in this previous post.

transit-access-chart


Here are some observations:

Downtown is insane

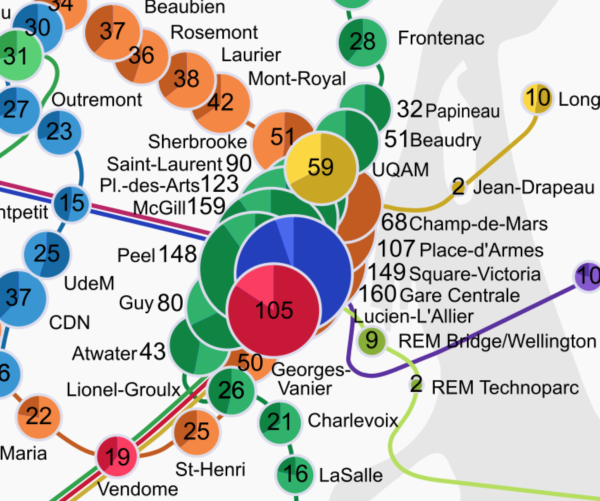
One thing I noticed when adding workplaces to the map is just how many people work downtown, and how important they are. When considering just population, Cote-Sainte-Catherine was the station with the most density around it, 28,000 people. Once you add in work places, the combined total reaches 160,000 for McGill and Gare Centrale. Those stations are incredible trip generators!

so many

Downtown Montreal. So many workplaces you can’t even visualize it.

According to the STM’s data, McGill and Berri-UQAM are actually the busiest stations. I believe that the census data did not consider the universities as ‘places of work’ for students. So McGill, Concordia, Berri-UQAM and Udem possibly each have another several tens of thousand students nearby who are not accounted for in the census data.

Badly paced outlying stations

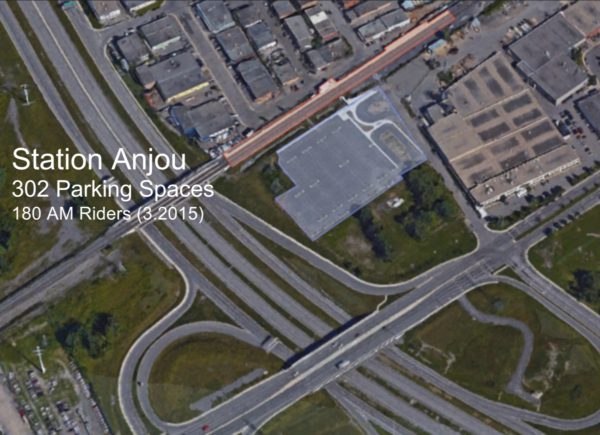
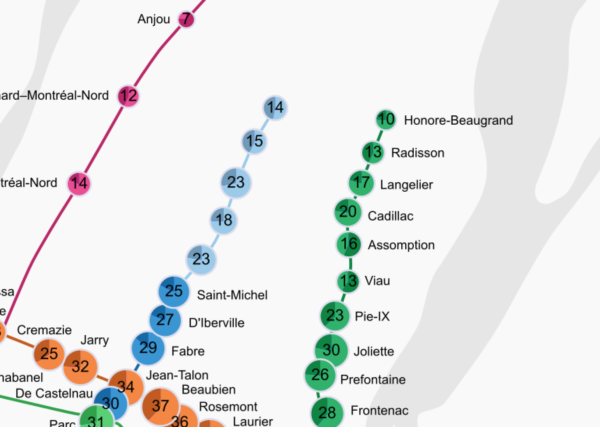
Another thing I realized is how bad some of the outlying stations are. One in particular is the Anjou station on the Mascouche line. I know there is a lot of population near that line in Montreal North and East, about as many as in the whole West Island (about 200,000 people). So why is the Anjou station doing so badly?

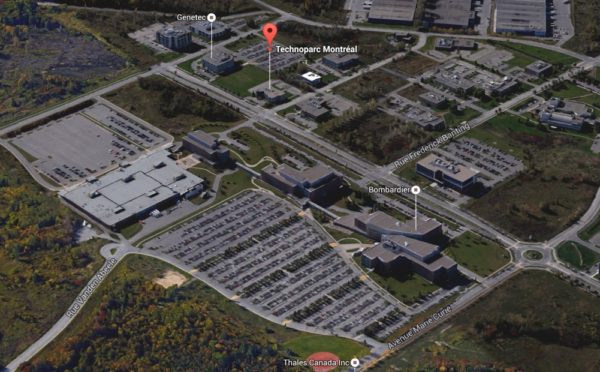
The answer can be found if you just look at it from above:

station-anjou

The stations is sandwiched between a highway, a large boulevard and a low-density industrial area. Basically the only thing within walking distance is a parking lot. The station was basically only designed for drivers coming in via the highway and using the park’n’ride. So its ridership can only ever be as large as the parking lot — that’s an ineffective use of space, money and transit; and focusing only on drivers is inequitable as well.

What about proposed stations?

I’m a little bit concerned that the transit projects that we have in the pipeline right now don’t consider walkability enough. The Blue Line extension appears to do okay, about as well or maybe a bit better as the Eastern Branch of the Green line.

blue-line-extension

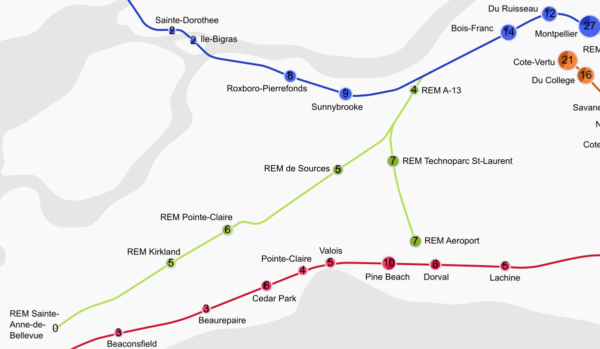
The REM stations on the other hand, being almost exclusively along highways, really don’t connect to much within walking distance. We hear how important the Technoparc Saint-Laurent is, with 7,000 workers — but if we compare that to the metro stations, it’s obvious that it’s really a small number.

west-island

Even stations in predominantly residential areas will have that many places of work, even though most of their surrounding area is for housing. And really, the Technoparc just a suburban office park, of supposedly ‘cleantech’ firms, but the area mostly consists of parking. In fact, if you work in one of those places, your car gets more space than you do:

Technoparc Saint-Laurent: worthy of a rapid transit stop?

Technoparc Saint-Laurent: worthy of a rapid transit stop?

The REM proposal also includes stations that are absolutely abysmal, like the Technopark Pointe-Sainte-Charles (2,000 workers). Moreover, the proposed station near Sainte-Anne-de-Bellevue is the only station with zero population and work places within walking distance in the whole Montreal region. At this point, it will mostly serve to induce sprawl.

There are proposals for some Transit Oriented Development, but since the corresponding are stations near highways, it will be difficult to build walkable neighborhoods from scratch. I really wish the 5.5 billion dollars in transit investment would result in better connections to existing neighborhoods.

Looking at all the data, it really makes me wish we would focus more on connecting to people within walking distance and making transit as effective as possible.
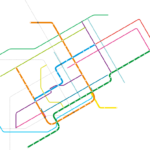
xkcd: Subways of North America

Monday, April 8th, 2013

Subways of North America

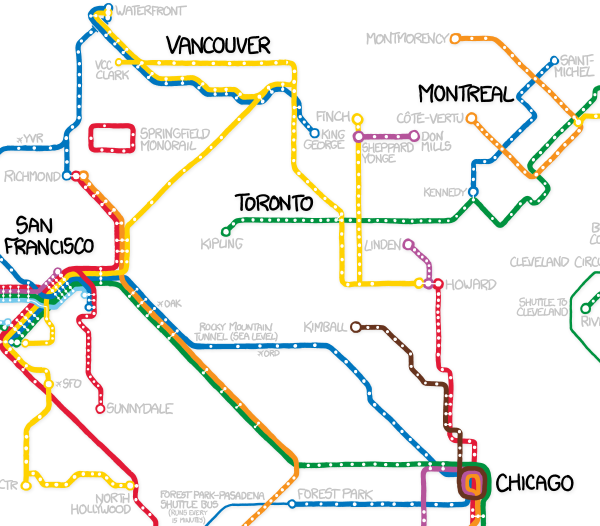
The webcomic xkcd put all real the subway systems of North America on one map, joined by imagined lines connecting the systems far away from another. Helpfully the author defines for us what he means by “subway”, for “the pedantic rail enthusiasts”:

a network containing high capacity grade-separated passenger rail transit lines which run frequently, serve an urban core, and are underground or elevated for at least part of their downtown route.

Sounds good enough to me.

Did you know that cities like Baltimore, Santo Domingo and San Juan have subway systems? That one in three subway stops are in NYC? That Springfield is located somewhere between Vancouver, Toronto and San Francisco? Well, now you know.

Walksheds Visualized
Showing Populations near Montreal Rail Stations

Wednesday, April 3rd, 2013

walksheds are the area around a particular point of interest from where people are willing to walk to said point of interest. This point of interest is often a transit station, and the walkshed gives an idea how many people will reach the station on foot. While the walkshed depends on how walkable the area is, whether there are barriers like freeways, the geometry of the street grid, and how attractive the transit station is (people are willing to walk further to metros compared to bus stops), The area is often simplified as a circle around the transit station.

Montreal

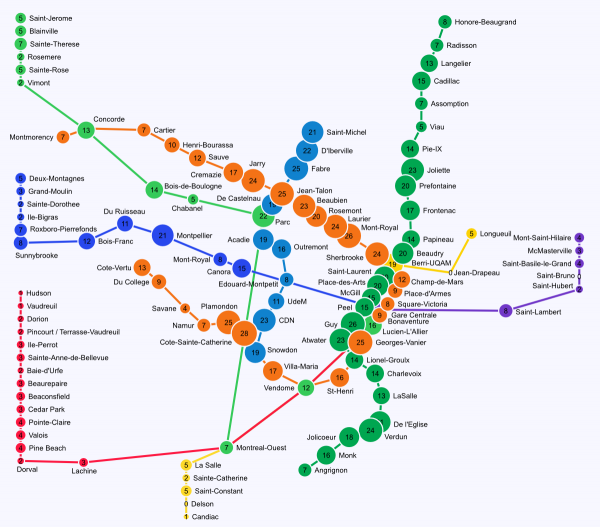
Montreal rail station walksheds – population within 800m of stations. The sizes of the circles and the numbers inside them correspond to the population in 1000 people

How much population lives within the walkshed gives an indication on the ridership of the transit line, the more people live in it – the more ridership can be expected. The corollary is that you want as much population within walksheds as possible.
If there are more people near the transit station, it reduces the reliance on feeder buses and park’n’rides (a reduction in park’n’rides also means more land within the walksheds is available for development). This will reduce both the cost of transportation services that have to be offered, and will increases the chances that people use transit – which will reduce the cost of required infrastructure like roads and parking spots, but will also decrease the burden on the environment.

The above visualization shows the population within 800m (1/2mile) of Montreal transit stations. This is considered a reasonable distance that people are willing to walk to a rail station. Picking this distance for all stations makes the comparison between stations easier, even if the actual walksheds may be different depending on how walkable the areas are. Also, a circle with 800m radius has about 2 square km of area, so by dividing the number by two, we get the population density (in people per square km).

In the image, we can see that many metro stations have more than 20 thousand people living near them, corresponding to more than 10 thousend people per square km. Compare that to the a density of 3.7K people/km² for the whole island of Montreal, 7.7 people/km² for the borough of Côte-des-Neiges–Notre-Dame-de-Grâcee, and 12.3K people/km² for the Plateau. The highest population is near station Cote-Ste-Catherine, the 2nd most populous is Mont-Royal, then Guy-Concordia (which also includes the most densest spot in Montreal).

We see that the commuter rail stations generally don’t have many people living near them, especially off the island. Some stations are directly next to highways, others are surrounded by a sea of parking, others are in the middle of nowhere. There is quite a deficit in Transit Oriented Development near many of the commuter rail stations, a missed opportunity. In many places, development would be a better use of station-adjacent land, compared to parking lots, or very low density development.

The most populous commuter rail stations outside of the inner city are on the Deux-Montagnes line, at least up to Roxboro – the Deux Montagnes line is the the only electrified line, has the most trains, and by far the most ridership. Some of the stations rival metro stations in terms of population density. Other populous stations are on the Blainville line, at least up to de la Concorde – it would seem that this stretch could also be a candidate for electrification, possibly more infill stations and much more frequent service (incidentally that would also help relieve congestion on the orange line).

What is interesting is that some metro stations have surprisingly little population near them. The missed development opportunities may not just exist near the commuter rail stations, but near the metro network itself. While some of those metro stations are also directly next to highways (like de la Savane) and have limited development opportunities, others are in very suburban looking areas that could probably be densified (like Assomption).

The data was created using the Canadian census data (from 2011), the gtfs for the STM and AMT was used to find the station locations. And a disclaimer: the stations are considered completely independently; so population of very close stations may be “counted” more than once.

Another historical Map: 1949 Montreal Land Use plan

Saturday, March 23rd, 2013

raw-land-use-plan-creases

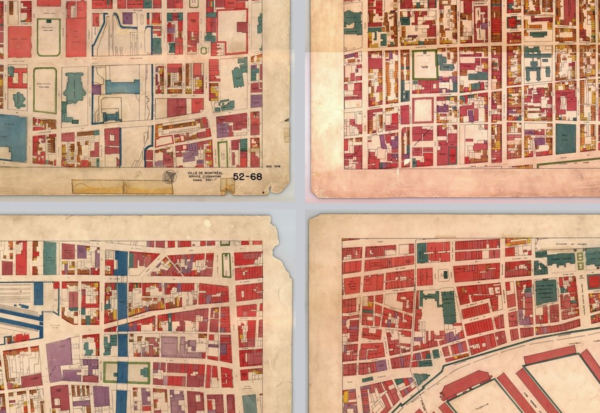
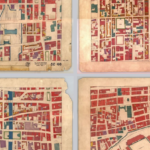
This blog wasn’t really meant to become about historical map mashups, but with the city of Montreal (and the Bibliothèque et Archives nationales du Québec) releasing all this interesting imagenary, I made the third map app within as many weeks. This one is a 1949 Land Use plan (source), showing a detailled view of the buildings, many of them named, their uses, street names. This map is not stitched together, and not overlayed with a modern view – it’s the raw scanned pages arranged in a grid. This makes for a primary source, not only showing the data of the map, but also showing the age of the paper it’s on, pencil scribbles, creases and tape fixes. The result looks like this:

Again there’s a full screen version, which can be found here. The 9 principal colors correspond to the following:

  • Jaune: résidentiel : unifamilial
  • Orange: résidentiel : duplex
  • Brun: résidentiel : triplex
  • Rouge: commerce
  • Rose: industries légères (alimentation, entreposage, vêtements…)
  • Violet: industries lourdes (mécanique, chimie, fonderie…)
  • Bleu: chemin de fer
  • Vert: parcs
  • Gris-vert: institutions (administration, écoles, églises…)

Note that some areas are not colored in: Those were not part of the city of Montreal, but independent municipalities. Montreal had quite strange boundaries and a weird shape, reaching the water in the North, but with many cut-outs all around. The city has consolidated much more, but some of those small cities (like Westmount, and TMR) are still holding on to their independence today.

map index

map index

All these map mashups I’ve showcased the last couple of weeks are a work in progress. I hope there will be one master map one day overlaying all the information in one app. This involves the major help of some pixel magicians who’ve been stitching and cleaning images (in particular mare and Luc). I thank them for all their work and hope for the continuation of these projects.

Then and Now Again:
1947 Aerial Photography vs Google Satellite

Wednesday, March 13th, 2013

1947overview

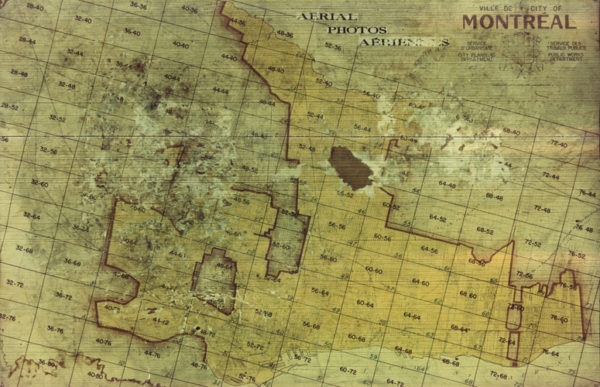
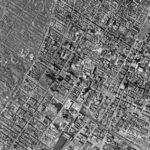
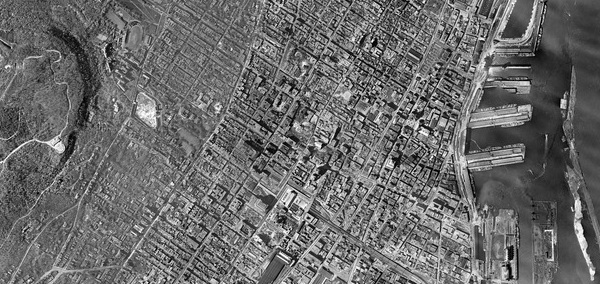
In a sort of continuation of my transit map mashup comparing transit maps from 1941 and 2011, I made another mashup comparing aerial photography from 1947 and now. The city of Montreal published aerial photos from the entire Montreal island, that were made between 1947 and 1949. I was able to get a version of stitched images of the downtown areas and the Plateau (via mare, who used some sort of stitching software). Rotated and Translated to approximately fit google satellite (which actually uses aerial photos as well), and put all together, it looks like this (A full screen version can be found here):

I’ll leave this without much comment, just go ahead and explore. I invite you to comment your observations.

Explore Two Montreal Transit Maps,
70 Years Apart

Monday, March 4th, 2013
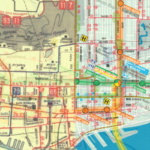
A zoomable version of two overlayed transit maps from 1941 and 2011 lets you explore the similarities and differences after 70 years of change

mix

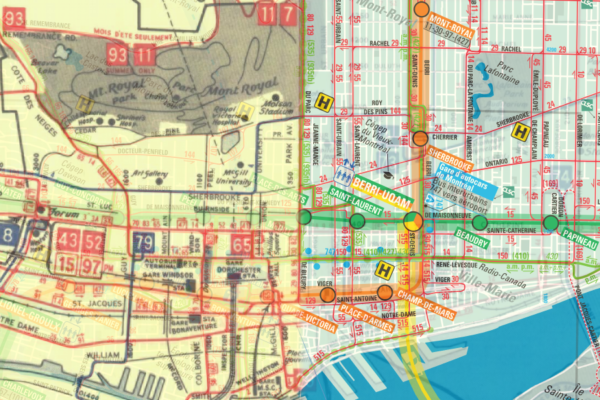
A transit map is not just some means to help people to get around, it can tell you a lot about a city. Where do people live, where do they go, where’s lots of activity. It can be part of the local culture in a way, intimately familiar to so many people. Take two maps, from 70 years apart, overlay them and you can see even more stories emerging. This is what I did with this little mash-up that lets you zoom around a transit map of Montreal from 1941 and from 2011, sliding between the old and the new, and exploring the differences between then and now (a full screen version can be found here).

Many things have changed. Back then, the primary mode of transit was the tram. A system of hundreds of kilometres that has completely disappeared. Today we have the metro, and bus lines on the surface. 70 years ago the city used to be much smaller. Even the island itself was smaller – it grew as garbage got dumped along Pointe-Saint-Charles, and as land was won with the dirt dug up by the metro (or so the lore goes), expanding islands to build parks and expo 67. It seems that the city also used to be more bilingual, with more English street names, and the map itself bilingual.

One thing that I found surprising is how similar the network is today compared to 70 years ago. The tram may have gone, but many of their lines continue to this day, served by buses – despite the lack of tracks, the construction of the metro, and 70 years of change. It seems as if more lines have survived than buildings. Physical constructs made of brick and concrete have gone, whereas lines on a map remained, served by an ever changing fleet of vehicles running transient schedules.

Note how bus/tram-lines survived, whereas heavier rail didn’t. This is a bit surprising because it goes against an idea in transit development today, that rail lines induce more development because people perceive the infrastructure to be more permanent. But in a way it makes sense: if a rail line gets used less and less, it becomes economically impossible to operate. People will also demand the space to be used for something else, perhaps for cars (like the third track on the shoulder of the Victoria bridge), or to expand the city. A street-running transit line, not using any significant space, cheaper to operate and paid within a larger network, can survive as a less and less frequent bus.

Consider the 15 – the line used to be served by trams along the main transit corridor on St-Catherine street. Nowadays it is a bus running in parallel to two busy metro lines, on an awkward not-quite 30 minute schedule, split along two one-ways, routed around pedestrian areas. Today it serves mostly elderly people because the metro is not accessible enough: smack in downtown, it gets only about 8 riders per run*. It has nearly outlived it’s usefulness as a major transit line – a kind of Tomasson?

Other lines that have survived are the busiest in the network. While the busiest line today** (121 Sauvé) didn’t exist back then, many of the busiest routes of today already existed 70 years ago in some form or another (like the 39, 51, 65, 80). Maybe this means that the need to travel along certain directions is ingrained deep in the city structure, which may be stronger than the buildings themselves.

* ~530 people per weekday in 2011, ~64 runs a day, ~8.3 riders per run.
** The ridership numbers are from a dump of a few weeks of opus data from 2011.

Montreal Frequent Service Map – Update

Thursday, February 14th, 2013

MontrealFrequentService150

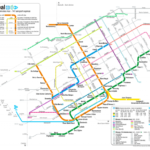
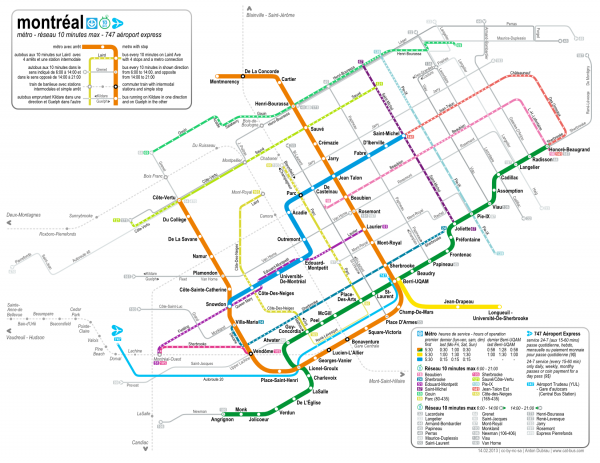
This has been a long time coming, I’ve finally gotten around to update my Montreal Frequent Service Map. This is a map of the Montreal Metro and the whole 10-Minute Max Network. There haven’t been many changes:

  • The 211 Lakeshore is not a 10 minute bus any more. The STM chose instead to create a network of West Island express buses. Some of these follow approximately the route of the 211, so many of the stops along that route may actually see frequent service to Metro Lionel-Groulx every 10 minutes. But the routes are not exactly the same, and the mess of that all is against the spirit of a frequent service map.
  • The 132 Viau is now the 136 Viau.
  • The daily pass needed to use the 747 airport express now costs 9$.

I also took the opportunity to enlarge the West Island, and improve the proportions west of the Orange line, and added the missing LaSalle commuter rail station. I again made a 600 dpi version, which can be found here, and a pdf.

A Map for Montréal’s frequent service

Thursday, September 2nd, 2010

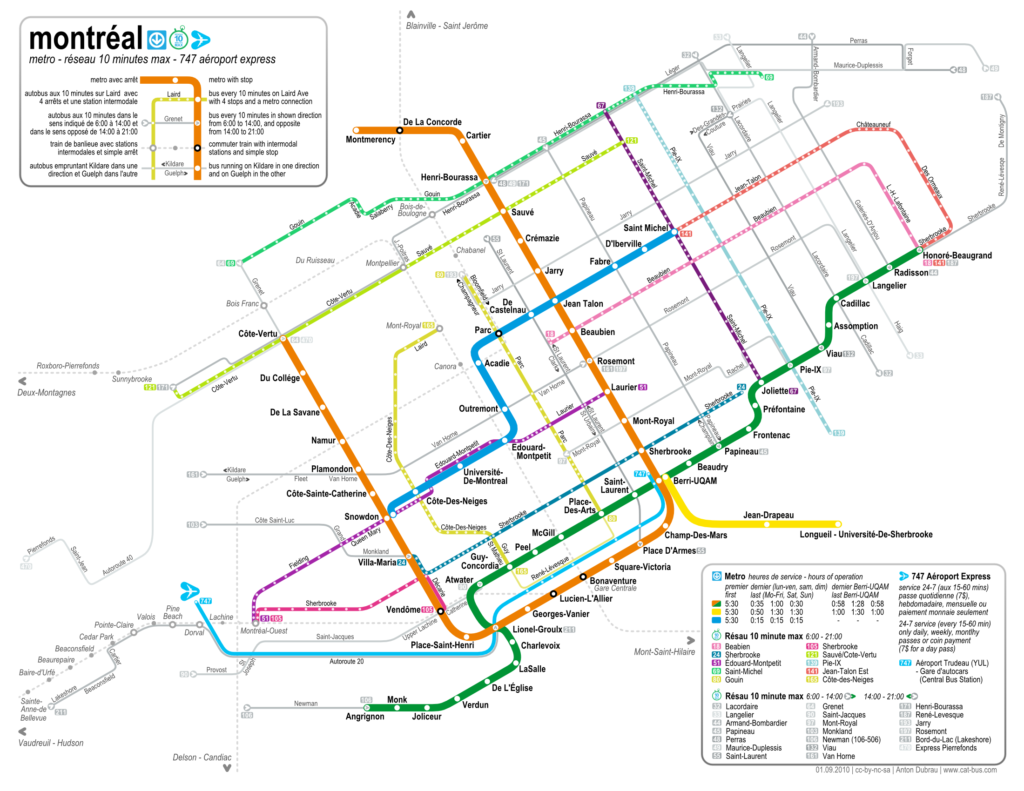
As mentioned in a previous post, I’ve been working on a frequent service map of Montreal’s new réseau 10 minute max (10 minute network). Just a couple of days after the new schedule went on effect on August 30th, I am now publishing this map (under cc-by-sa-nc).

The stm also published a map. But theirs is basically just the full system map with the whole system (except the metro) removed and the frequent lines added in thick lines — it’s still a huge map (because it is geographically accurate), for a relatively simple system. Also, the lines often sit on top of the metro lines, so it’s hard to read.

I wanted to make a map that is similarly abstract as the old metro map, to show the similarity between the frequent service network and the metro system itself. Both should be accessible without needing any schedules, or knowing the area well where one is travelling. I wanted to combine the simplicity of the traditional tube map with the look and feel of the Montreal metro map (and the new stm designs) while adding in the frequent bus lines – and all that in a letter format.

The result is indeed letter sized (with 5mm margins), and designed to fold twice (along the legend boxes), albeit with some pretty small fonts. Nevertheless, it should be possible to carry this map along all journeys much more easily than the whole system map — this independence is sort of the intent of the original London tube map, and also of the new frequent service network.

I added the commuter train stations on the island of Montreal, something that the metro map doesn’t show. Although they don’t run frequently, the connections are good to know and an imprtant aspect of the public transportation network — so they are shown in greyed out, dotted lines. I also added the airport express bus, even though it runs at a lower frequency than 10 minutes, because of it’s success and general importance. The legend shows that it runs less often.

The stm chose a system of 11 lines with 10-minute frequent service running form 6am to 9pm, and a set of 19 lines that run frequent in the downtown direction from 6am to 2pm, and in the opposite between 2pm and 9pm. These lines don’t qualify as all-day frequent service, so they are also shown greyed out, with arrows indicating the morning/downtown direction. I assigned colors to the all-day frequent lines as if they were metro lines, based on the sort of pastell color theme of the stm.

A feature that is not even in the full system map is the indication of all stops along the bus lines. While I didn’t actually name any, it still provides useful information – it gives an indication of how long it takes to traverse a certain route (the more stops the longer it takes), and it gives an idea of how many stops it takes to go from one intersection to another. The one should help people to be more independent of schedules by being able go estimate how long a trip will take, and the other helps people to navigate the city riding the bus without knowing a certain area. Both are intended to lower the barrier of entry for new users (or users new to an area, or tourists) to be able to use the bus system. A focus on usability in public transport systems (especially buses) is sometimes lacking, but attempting to create user experience similar to a metro system should help attracting riders.

A 600 dpi version can be found here. And a pdf. Or the svg. (update: I correct errors only on these files.)

This project was partly inspired by Jarret Walkers treatment of frequent service ideas over at human transit. Most of the above links direct to his discussions of the topic. I have also taken a closer look at the bus network.

Check out the most recent update.